
Page 8 - Bar Graphs
P. 8
(d) Complete the bar graph below. Draw bars to show the
number of fish. Use one block for each fish you count.
Draw another bar graph for the Hibuna.
Number of Huna of different lengths in Tank A
8
7
6
Number of fish 5
4
3
2
1
Small Medium Large
Groups
7.4 Information in pie charts
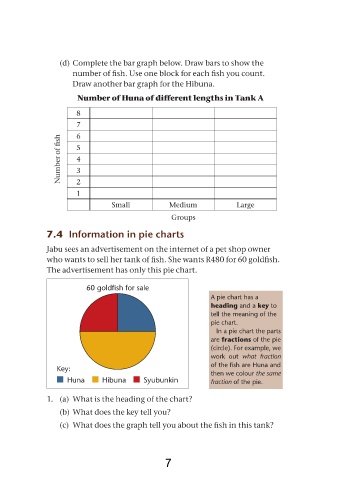
Jabu sees an advertisement on the internet of a pet shop owner
who wants to sell her tank of fish. She wants R480 for 60 goldfish.
The advertisement has only this pie chart.
60 goldfish for sale
A pie chart has a
heading and a key to
tell the meaning of the
pie chart.
in a pie chart the parts
are fractions of the pie
(circle). For example, we
work out what fraction
of the fish are huna and
Key:
then we colour the same
huna hibuna syubunkin fraction of the pie.
1. (a) What is the heading of the chart?
(b) What does the key tell you?
(c) What does the graph tell you about the fish in this tank?
7