
Page 14 - Bar Graphs
P. 14
dAtA hAndling
Reading data in tables
To understand data, we have to understand the situations that
give the data. Hold a class discussion about the problem of
rhino poaching. Ask your Social Sciences teacher to help you
understand where the Kruger National Park is.
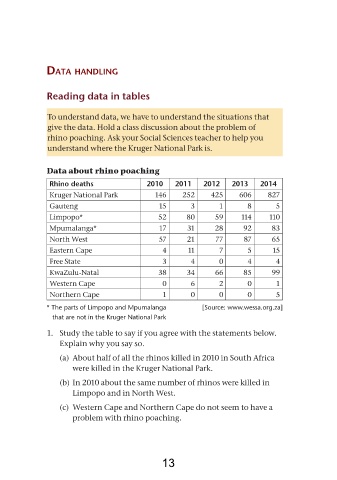
Data about rhino poaching
Rhino deaths 2010 2011 2012 2013 2014
Kruger National Park 146 252 425 606 827
Gauteng 15 3 1 8 5
Limpopo* 52 80 59 114 110
Mpumalanga* 17 31 28 92 83
North West 57 21 77 87 65
Eastern Cape 4 11 7 5 15
Free State 3 4 0 4 4
KwaZulu-Natal 38 34 66 85 99
Western Cape 0 6 2 0 1
Northern Cape 1 0 0 0 5
* the parts of limpopo and mpumalanga [source: www.wessa.org.za]
that are not in the Kruger national Park
1. Study the table to say if you agree with the statements below.
Explain why you say so.
(a) About half of all the rhinos killed in 2010 in South Africa
were killed in the Kruger National Park.
(b) In 2010 about the same number of rhinos were killed in
Limpopo and in North West.
(c) Western Cape and Northern Cape do not seem to have a
problem with rhino poaching.
13