
Page 17 - Bar Graphs
P. 17
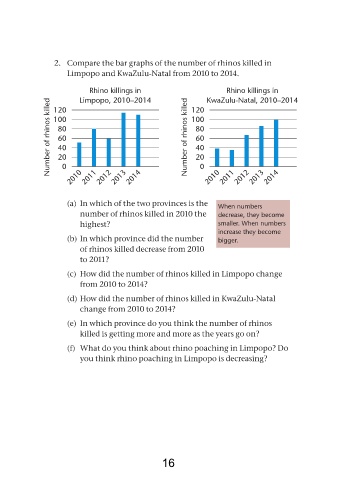
2. Compare the bar graphs of the number of rhinos killed in
                      Limpopo and KwaZulu-Natal from 2010 to 2014.

                             rhino killings in              120  KwaZulu-natal, 2010–2014
                                                                       rhino killings in
                         limpopo, 2010–2014
                number of rhinos killed  100              number of rhinos killed  100
                  120


                                                             80
                   80
                                                             60
                   60
                                                             40
                   40
                   20
                                                             20
                    0
                       2010  2011  2012  2013  2014            0  2010  2011  2012  2013  2014


                      (a) In which of the two provinces is the      When numbers
                          number of rhinos killed in 2010 the       decrease, they become
                          highest?                                  smaller. When numbers
                                                                    increase they become
                      (b) In which province did the number          bigger.
                          of rhinos killed decrease from 2010
                          to 2011?

                      (c) How did the number of rhinos killed in Limpopo change
                          from 2010 to 2014?
                      (d) How did the number of rhinos killed in KwaZulu-Natal
                          change from 2010 to 2014?

                      (e) In which province do you think the number of rhinos
                          killed is getting more and more as the years go on?

                      (f) What do you think about rhino poaching in Limpopo? Do
                          you think rhino poaching in Limpopo is decreasing?


                                                   16