
Page 15 - Bar Graphs
P. 15
2. (a) If you have not yet done so, calculate how many rhinos
were killed in total every year from 2010 to 2014.
(b) Calculate the number of rhinos killed in each of the
provinces between 2010 and 2014.
(c) Do you think the problem of rhino poaching is getting
worse or better? Explain why you say so.
Reading data in bar graphs
We draw graphs to help us see quickly how to compare data. Bar
graphs are not as accurate as data in tables, so we have to estimate
carefully when we read graphs.
1 400
number of rhinos killed 1 200
1 000
800
600
400
200
0
2010 2011 2012 2013 2014
Years
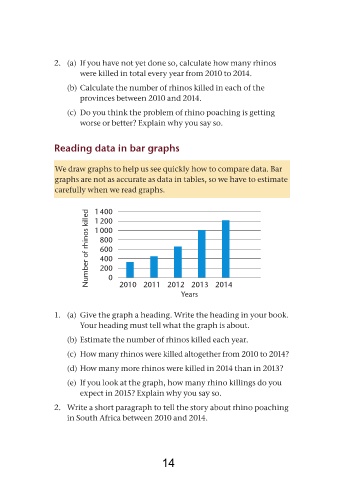
1. (a) Give the graph a heading. Write the heading in your book.
Your heading must tell what the graph is about.
(b) Estimate the number of rhinos killed each year.
(c) How many rhinos were killed altogether from 2010 to 2014?
(d) How many more rhinos were killed in 2014 than in 2013?
(e) If you look at the graph, how many rhino killings do you
expect in 2015? Explain why you say so.
2. Write a short paragraph to tell the story about rhino poaching
in South Africa between 2010 and 2014.
14